Got My Hands on Prometheus Up & Running
While I’m not new to Prometheus, I recently decided to dig deeper by picking up Prometheus: Up & Running, 2nd Edition.
I’ve been enjoying the book’s practical, hands-on approach, it doesn’t waste time on fluff, and dives straight into exploration and implementation using a local Prometheues setup. Even with my prior experience, it’s refreshing to revisit core concepts with fresh perspective.
I’ve been following along using a slightly modified Docker Compose stack that I shared some time ago, though the first chapter does a good job helping you set it up from scratch.
Chapter 3, titled Instrumentation, walks us through writing a small amount of Python to get hands-on with exposing custom metrics.
This code sets up a basic HTTP web application alongside a Prometheus scrape target. The target exposes a few Counter metrics to track the total number of requests and sales, as well as a Histogram metric to measure request latency.
#!/usr/bin/env python3

import time
import random
import http.server

from prometheus_client import start_http_server, Counter, Histogram


REQUESTS = Counter('hello_worlds_total', 'Hello Worlds requests.')
LATENCY = Histogram('hello_worlds_latency_seconds', 'Time for a request to hello world')
SALES = Counter('hello_worlds_sales_total', 'Total sales in dollars')


class MyHandler(http.server.BaseHTTPRequestHandler):
    """
    Our base handler
    """

    def do_GET(self):
        """
        Base endpoint
        """

        REQUESTS.inc()
        start = time.time()

        dollars = random.random()
        SALES.inc(dollars)

        # get our max delay from file on each request
        with open ('../max.txt') as f:
            max = int(f.read())

        # simulate latency by adding random delays
        time.sleep(random.uniform(0.0, max))

        self.send_response(200)
        self.end_headers()
        self.wfile.write(f"Sale completed for ${dollars}".encode())

        latency = time.time() - start
        print(f'Took {latency} seconds')
        LATENCY.observe(latency)


if __name__ == '__main__':
    start_http_server(8000)
    server = http.server.HTTPServer(('0.0.0.0', 8001), MyHandler)
    server.serve_forever()
I’ve introduced a random delay into the script to simulate request latency. The upper bound of this delay is configurable via a simple max.txt file, making it easy to adjust latency without modifying the code.
$ cat ../max.txt
1
To simulate traffic, I used a simple Bash for loop to send repeated requests to the application’s HTTP endpoint.
$ for i in $(seq 1 1000) ; do curl http://localhost:8001/ ; echo "" ; done
Sale completed for $0.643447998728374
Sale completed for $0.20655645181760451
Sale completed for $0.3430583873615538
Sale completed for $0.9870513240569891
Sale completed for $0.4996486064236859
Sale completed for $0.005858040129756881
Sale completed for $0.17978535417495534
Sale completed for $0.06004794488137899
Sale completed for $0.557212032129154
About a quarter of the way through this loop I increased my max delay:
$ echo 3 > ../max.txt
With this basic instrumentation and traffic simulation in place, a few targeted PromQL queries reveal a range of valuable insights into the application’s behavior and performance.
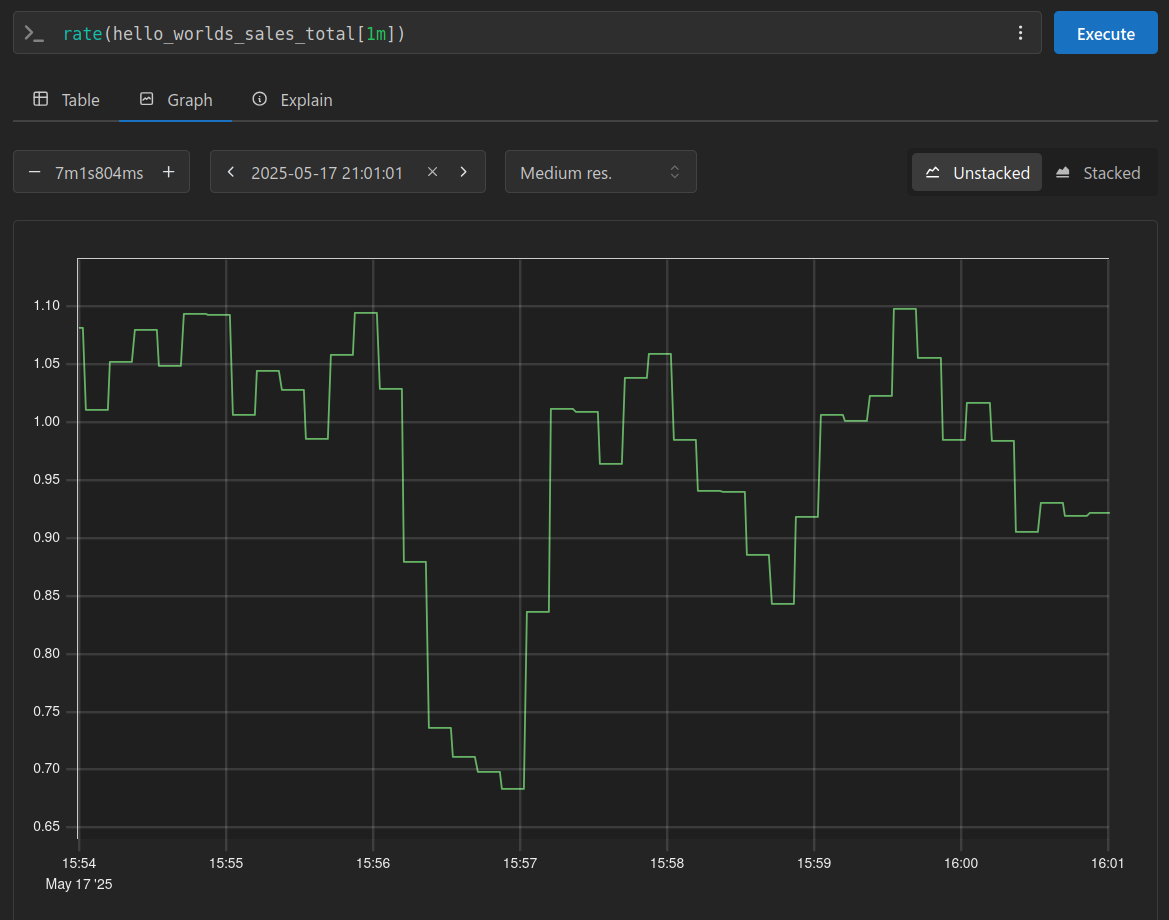
We can see our profit per second by using a simple rate function on our Counter:
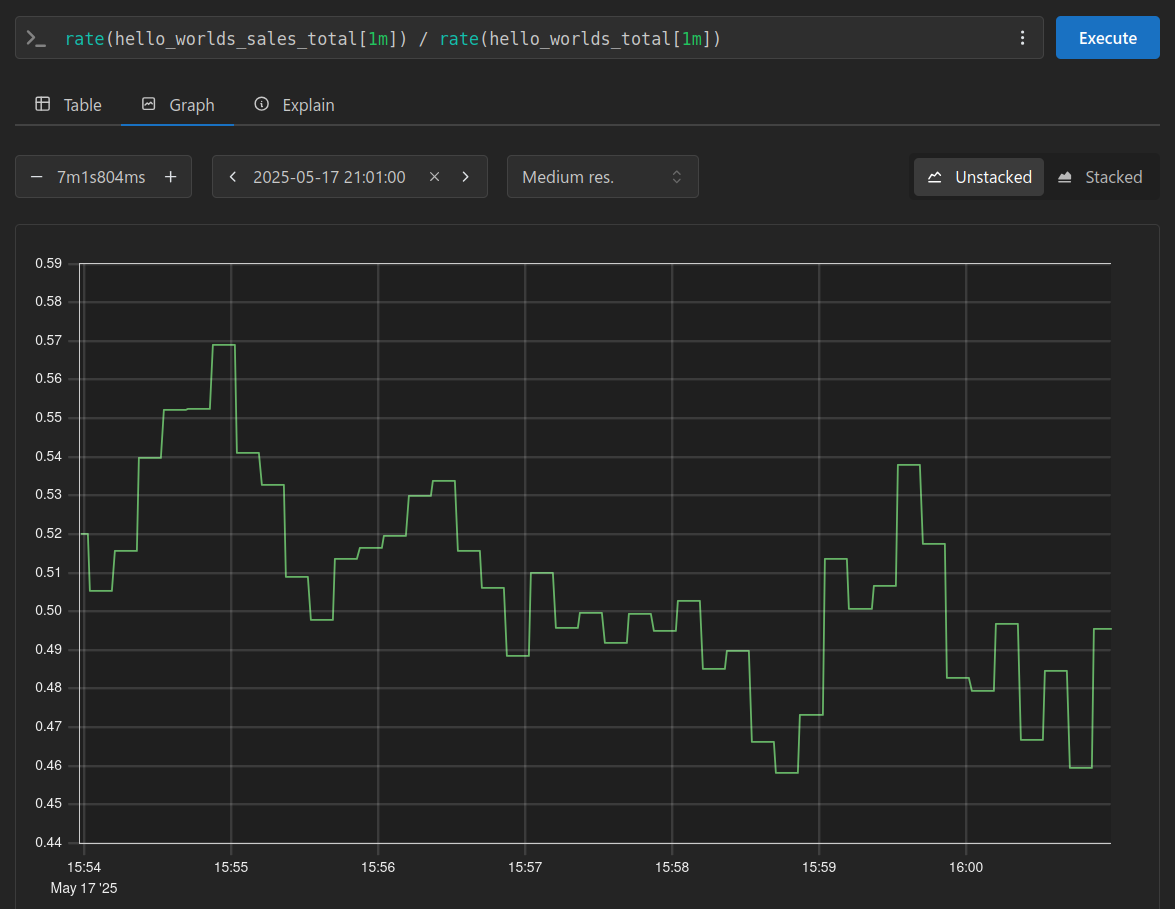
Calculating the average profit per request is straightforward, simply divide the rate of total profit by the request rate.
In our code, we use Python’s random.random() function to generate a floating-point number between 0.0 and 1.0, this is then used as the dollar total of the sale.
This explains why the average value trends toward 0.5 in our chart.
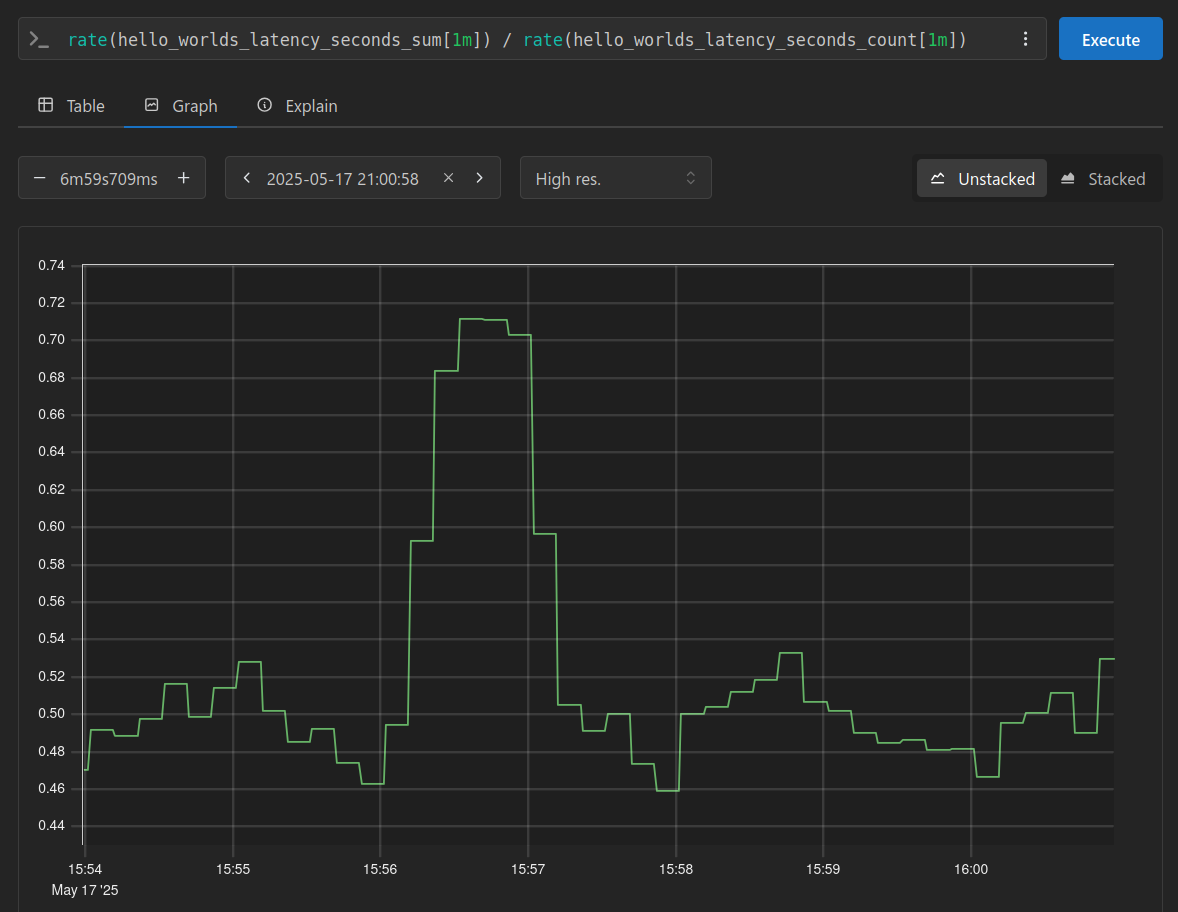
The histogram we’re using to track latency provides two counters, this allows us to calculate the average request latency. Since we started with a delay ranging from 0.0 to 1.0 seconds, we would expect the average to trend around 0.5 seconds. As shown in the initial portion of the graph, this is precisely what we observe.
As I mentioned earlier, I increased the delay to a maximum of 3 seconds for a brief period. This change is clearly visible at the 15:56 timestamp in the graph, then trends down as I reverted back to 1 second.
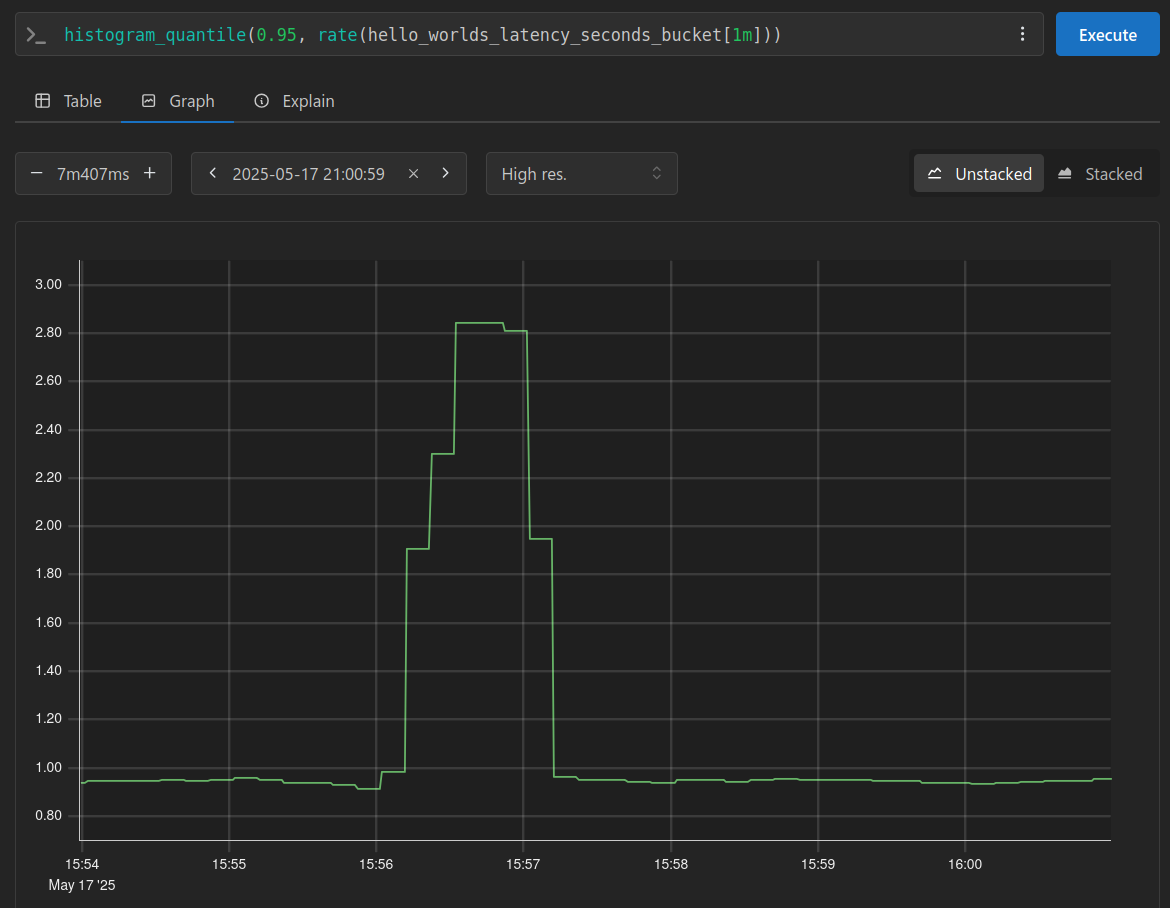
This histogram also provides buckets to track response time ranges, by using the histogram_quantile function, we can identify our worst-case response times, often referred to as the p95 response times.
At the same timestamp where I increased the maximum delay, we can observe that our worst response times have risen to nearly 3 seconds.
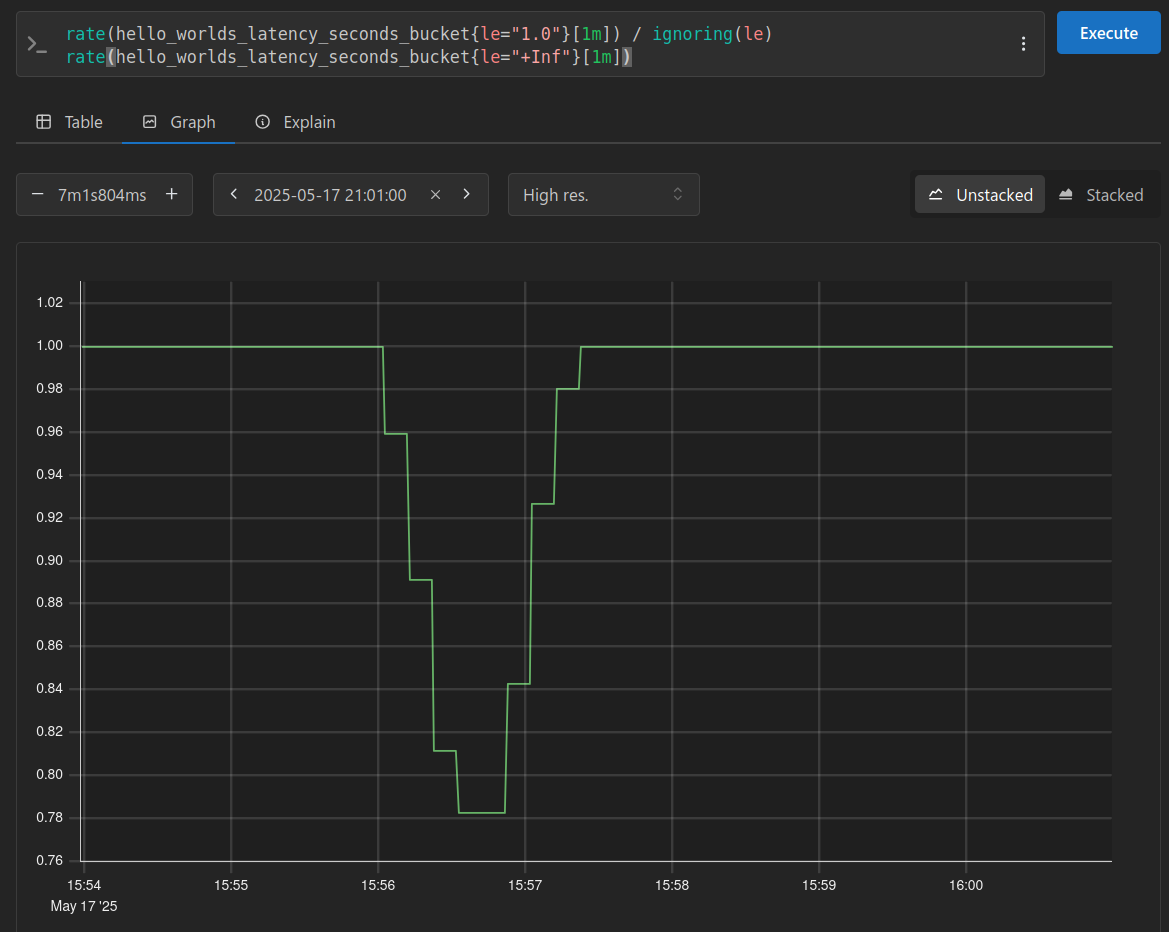
Finally, we can leverage these buckets to implement a simple check for SLA violations. Since I initially set the maximum delay to 1 second, I tracked the percentage of requests that completed within that time, expecting it to be 100%. After increasing the maximum delay to 3 seconds, I anticipated a drop, all seen in the graph below:
I hope you found this insightful! If you did, be sure to check out Prometheus: Up & Running, 2nd Edition. by Julien Pivotto and Brian Brazil. Cheers!