As I’ve been playing around with Telegraf and Grafana , I’ve noticed CPU interrupts and context switches are not apart of the standard metric gathering.
We know vmstat shows this information, and can be shown it in a easy processable list form:
$ vmstat -s
 1016888 K total memory
 497920 K used memory
 184412 K active memory
 173296 K inactive memory
 518968 K free memory
 70276 K buffer memory
 86416 K swap cache
 522236 K total swap
 88460 K used swap
 433776 K free swap
 18175 non-nice user cpu ticks
 0 nice user cpu ticks
 17799 system cpu ticks
 172172 idle cpu ticks
 7214 IO-wait cpu ticks
 0 IRQ cpu ticks
 2412 softirq cpu ticks
 0 stolen cpu ticks
 227755 pages paged in
 986944 pages paged out
 2353 pages swapped in
 121572 pages swapped out
 458705 interrupts
 1467529 CPU context switches
 1461773910 boot time
 3456 forks
I decided to hack together a little exec plugin for Telegraf using a Python script, running the script will get you standard out JSON:
$ /cpu.py
{
 "CPU context switches": 1487011,
 "IO-wait cpu ticks": 7375,
 "IRQ cpu ticks": 0,
 "K active memory": 190392,
 "K buffer memory": 70756,
 "K free memory": 512988,
 "K free swap": 433776,
 "K inactive memory": 173296,
 "K swap cache": 86560,
 "K total memory": 1016888,
 "K total swap": 522236,
 "K used memory": 503900,
 "K used swap": 88460,
 "boot time": 1461773910,
 "forks": 3607,
 "idle cpu ticks": 183663,
 "interrupts": 465536,
 "nice user cpu ticks": 0,
 "non-nice user cpu ticks": 18424,
 "pages paged in": 227767,
 "pages paged out": 990560,
 "pages swapped in": 2353,
 "pages swapped out": 121572,
 "softirq cpu ticks": 2418,
 "stolen cpu ticks": 0,
 "system cpu ticks": 17902
}
The script is a little hacky, but gets the job done for these test: cpu.py
#!/usr/bin/env python
import commands
import json

output = {}
raw = commands.getstatusoutput('vmstat -s')
raw = raw[1].split('\n')

for row in raw:
    value = int(row.split()[0])
    key = ' '.join(row.split()[1:])
    output[key] = value

print json.dumps(output)
All that is left is to add this script to Telegraf as a plugin:
$ cat /etc/telegraf/telegraf.d/cpu.conf
[[inputs.exec]]
 command = "/cpu.py"
 data_format = "json"
 name_suffix = "_cpu"
 interval = "5s"
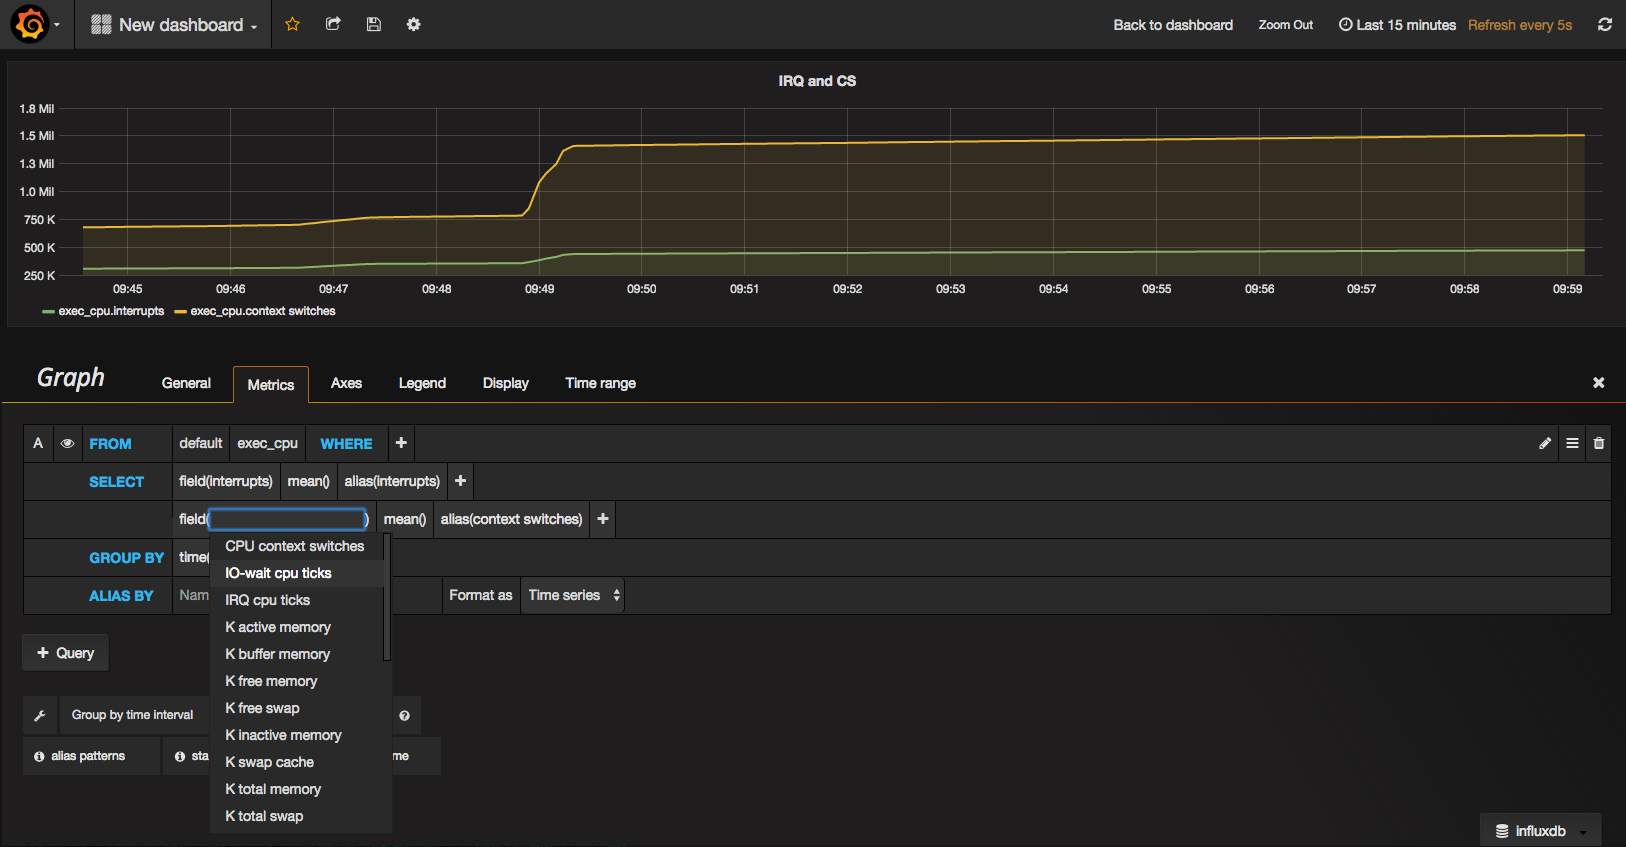
And now we have access to all the counters shown in vmstat: